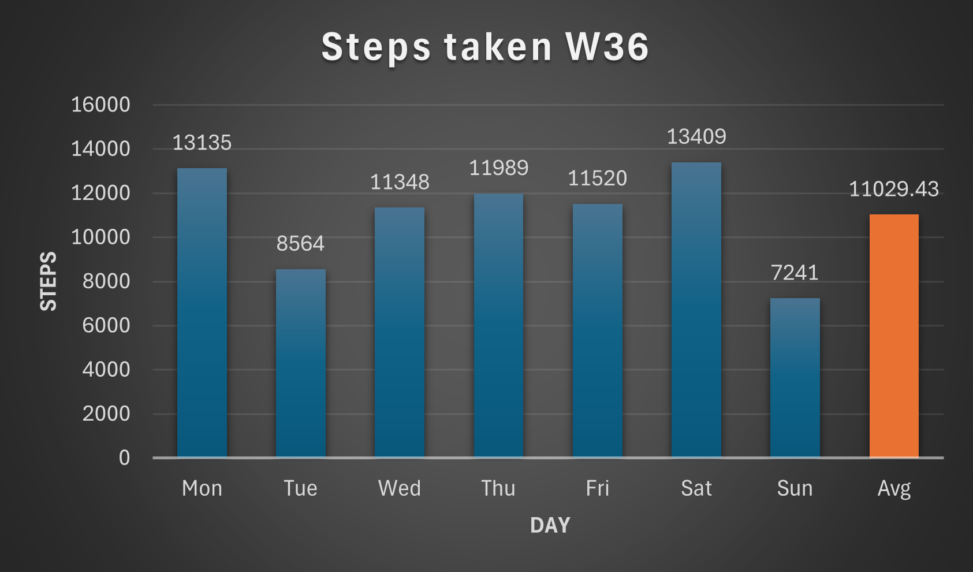
The graph shows how many steps i took each day during week 36. The y-axis shows the amount of steps(0-16000), and the x-axis shows the day correlated to the steps(Monday-Sunday), as well as the average.
Monday:13135, Tuesday:8564, Wednesday:11348, Thursday:11989, Friday:11520, Saturday:13409, Sunday:7241, Average:11029.43.
The data are my own personal records, and the visualization was created by me. The copyright to the visualization belongs to me.