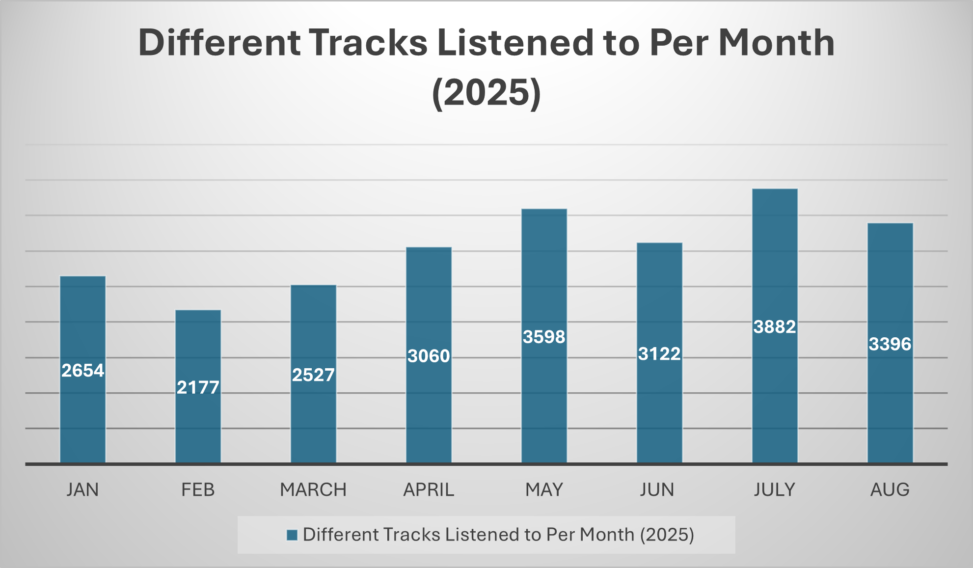
The data is a visualization of how many different tracks I have streamed per month in the year 2025. It shows that in the summer, the number increases considerably. The drastic drop in February could be partially attributed to this month having less days. Graph made in Word.