
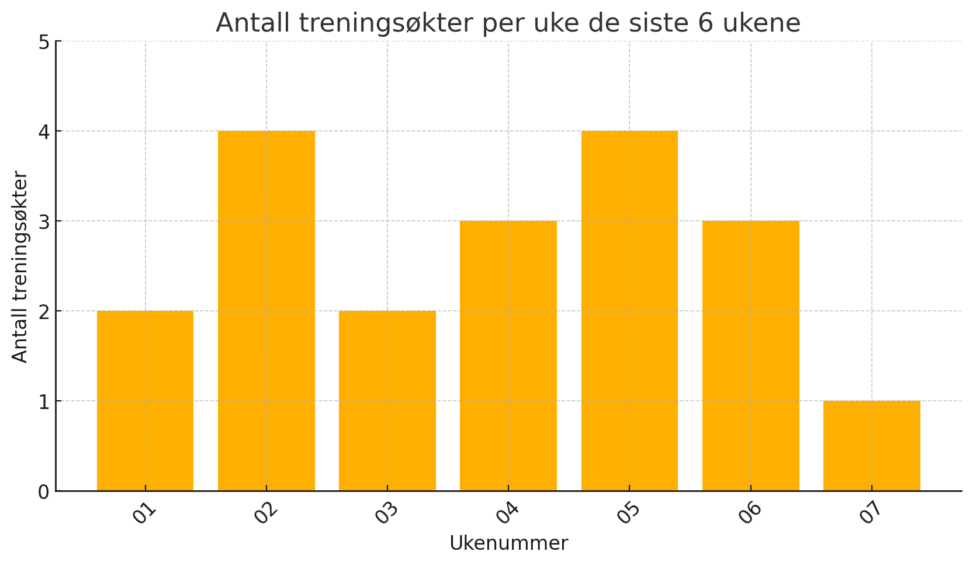
The bar chart represents the number of workout sessions per week over the past six weeks. The x-axis indicates the week numbers (following the ISO week date system), and the y-axis represents the number of training sessions per week. Each bar corresponds to the total number of training days recorded within that specific week. The data is based on personal training logs, tracking whether a workout session was performed (binary: 1 for training, 0 for rest day). The time range covers the last 42 days.
The data visualized in this chart is privately owned and personally recorded, not derived from any external sources. Since this data is generated and owned by the individual, it is not subject to external copyright restrictions.