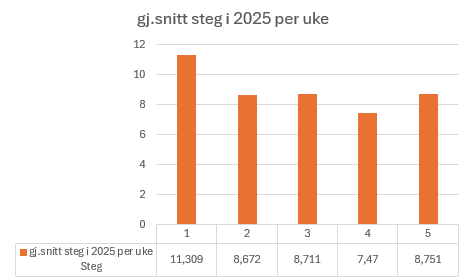
A chart showing the average amount of steps I’ve taken each week in 2025. The y-axis shows steps while the x-axis shows the weeks. Below you will find a matrix showing the numbers in detail.

A SPLOT on the Web: DALI worlds.
Blame @cogdog for the TRU Collector Theme, based on Fukasawa by Anders Norén.
A chart showing the average amount of steps I’ve taken each week in 2025. The y-axis shows steps while the x-axis shows the weeks. Below you will find a matrix showing the numbers in detail.