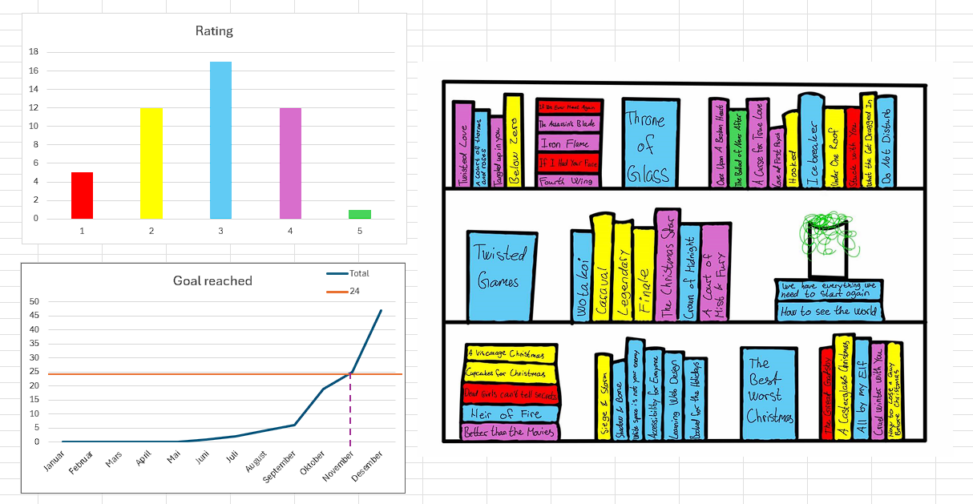
I made this data in excel. I drew the bookself to represent how many books I’ve read and the ratings for the different books. I used the same rating colors as the rating graph I made to see an average of the rating I gave the books in 2024. I also have a graph showing when I read books and when I reached the goal I made for 2024.