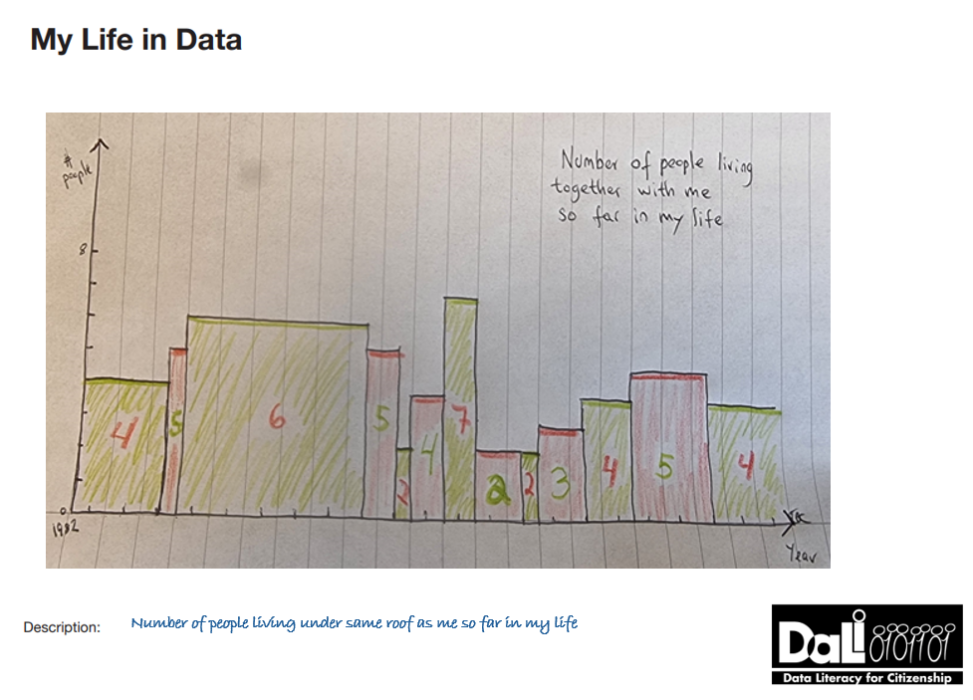
Number of people living under same roof as me so far in my life represented in a classic two dimensional column chart. X axis representing year span, y axis number of people.

A SPLOT on the Web: DALI worlds.
Blame @cogdog for the TRU Collector Theme, based on Fukasawa by Anders Norén.
Number of people living under same roof as me so far in my life represented in a classic two dimensional column chart. X axis representing year span, y axis number of people.