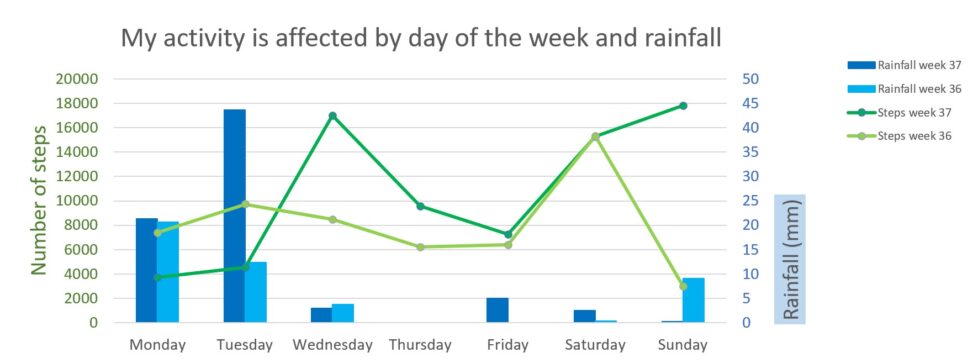
Two weeks of my daily steps are compared to the amount of rainfall per day measured in my city. The number of steps are displayed as points interconnected with lines in green. The idea was that this might give an association to a mountainous horizon, which is representative of my daily activity as the days with many steps included a hike to a nearby mountain. The number of steps can be read from the left vertical axis. The rainfall in millimeters are displayed as vertical bars in blue as this represents the amount of water we get on the ground. The amount of rainfall can be read off in millimeters from the vertical axis to the right in the plot. The colors for week 36 (4-10 Sept. 2023) are slightly lighter than those for last week (week 37, 11-17 Sept- 2023) as these days might also appear a slightly faded in my memory.


