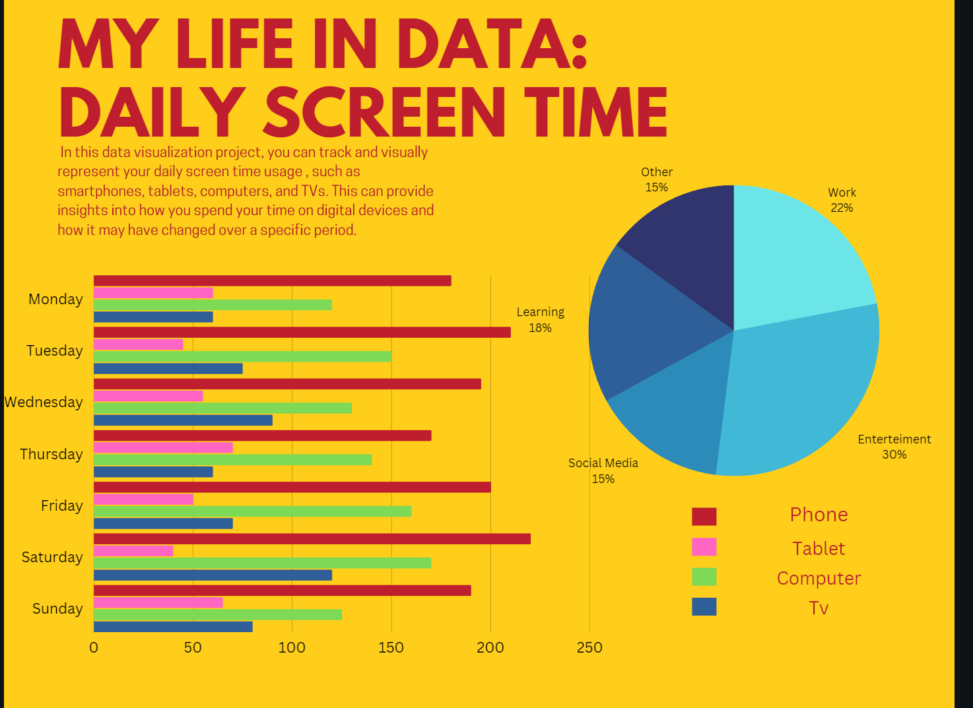
In this data visualization project, you can track and visually represent your daily screen time usage across different devices, such as smartphones, tablets, computers, and TVs. This can provide insights into how you spend your time on digital devices and how it may have changed over a specific period.


