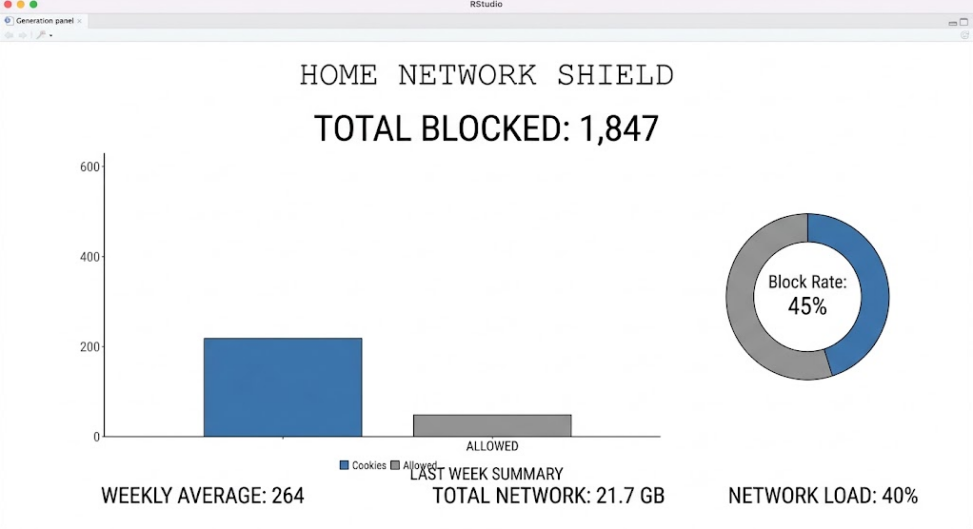

This is a screenshot of the RStudio visualization panel displaying the “cookie-blocked-dashboard” of my homenetwork, I call “Home Network Shield”. It shows a grand total of 1,847 blocked requests. The left side features a bar chart comparing large numbers of blocked cookies and ads against the much smaller number of allowed requests. On the right, a donut chart highlights the measly 45% block rate. At the bottom, a weekly summary provides the daily average being 264 blocked requests, my total network usage (21.7 GB), and a network load metric (40%).