
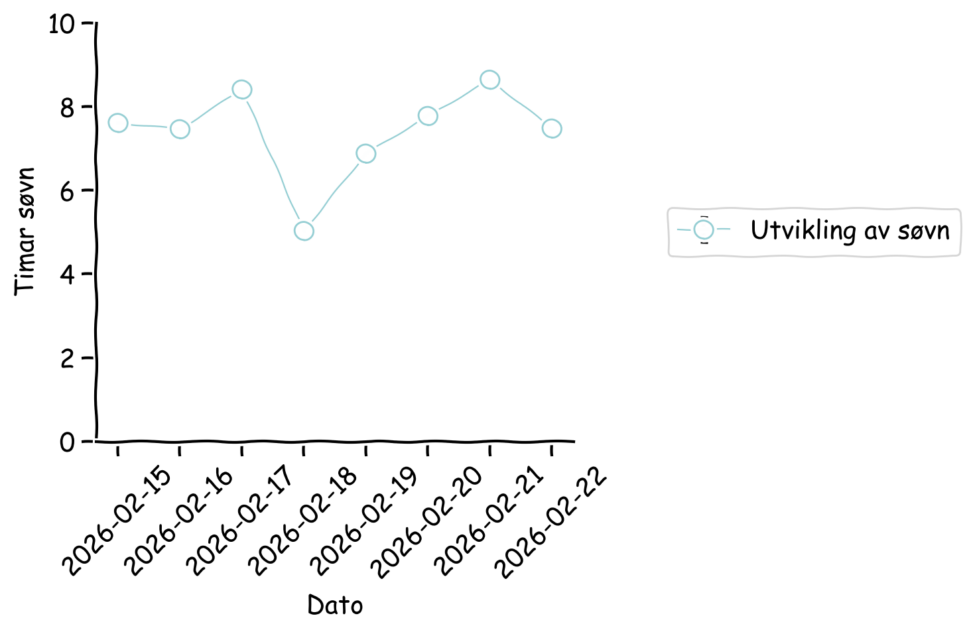
This line chart shows my personal sleep duration over the past week.
The x-axis represents the date (2026-02-15 to 2026-02-22), and the y-axis shows hours of sleep per night (hours).
Each point corresponds to the total number of hours I slept that night, illustrating how my sleep changed day by day during the week.
Data owner:
The data is self-collected personal data created by me. I am the owner of the dataset. It is not taken from any external source and is not published under a public licence.