
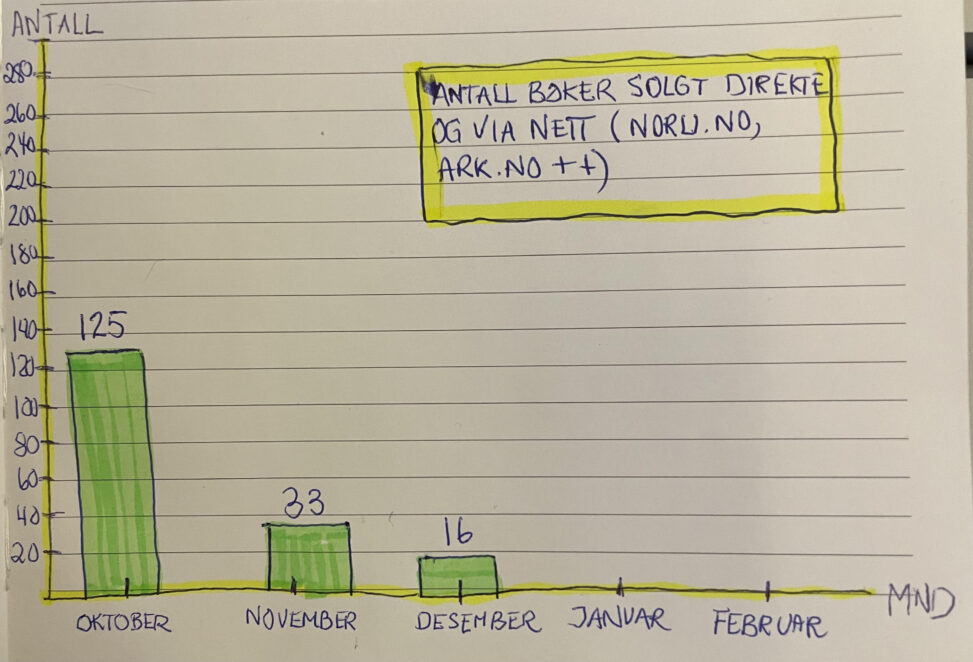
This data visualization presents the number of units sold of a self-published poetry collection per month during the fourth quarter (Q4) of 2025. The time period covered is October, November, and December 2025.
The horizontal axis represents the months (October–December 2025), and the vertical axis represents the number of copies sold (units). Sales figures include both direct sales handled by the author and sales through online retailers.
The visualization illustrates a peak in October (125 units), followed by lower sales in November (33 units) and December (16 units), reflecting post-launch sales development.
Data ownership and copyright status:
The data is privately collected and owned by Camilla Flesland. It is based on the author’s own sales records and retailer sales reports. The dataset is not publicly available and is shared under full copyright. All rights reserved.