
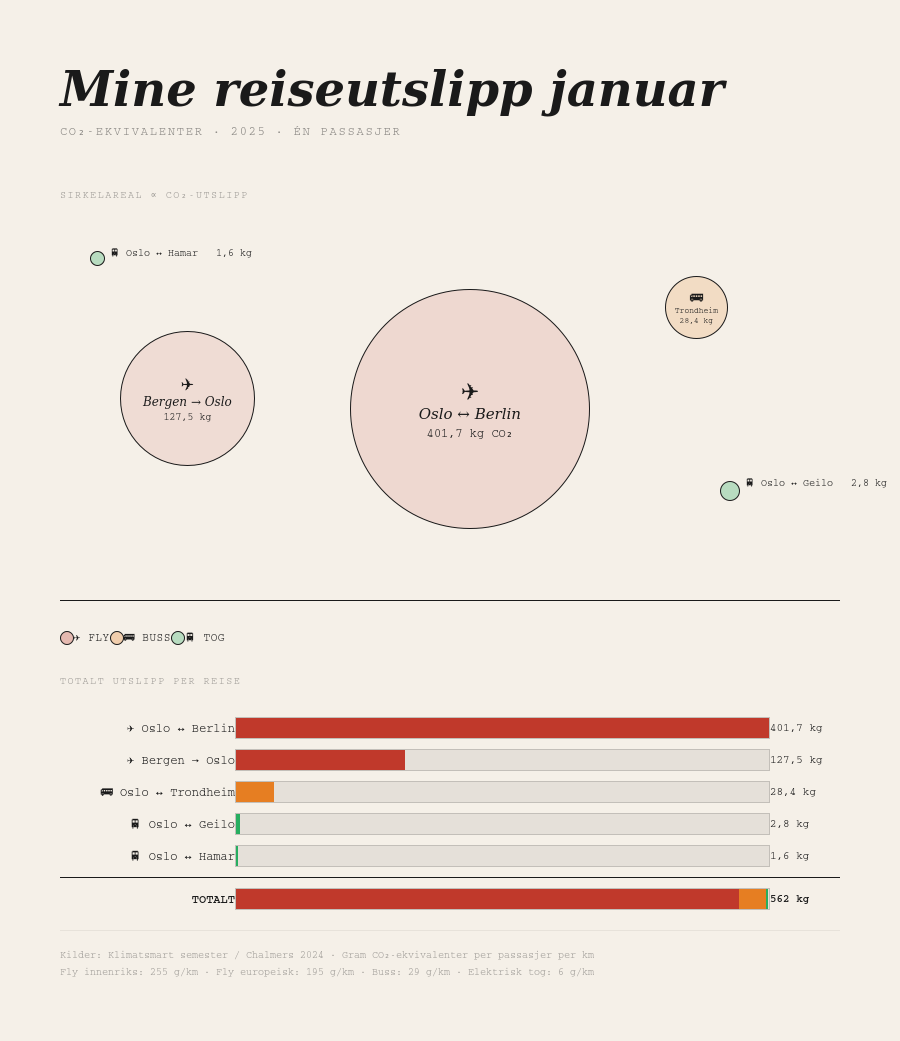
This visualization shows my personal CO₂ emissions from five trips taken in January 2025. Each journey is represented by a proportional circle (where the area corresponds to the amount of CO₂ emitted) and a horizontal bar chart showing the exact figures in kilograms of CO₂ equivalents per passenger.
Trips included:
Bergen → Oslo (flight): 127.5 kg CO₂
Oslo ↔ Hamar (train): 1.6 kg CO₂
Oslo ↔ Trondheim (bus): 28.4 kg CO₂
Oslo ↔ Berlin (flight): 401.7 kg CO₂
Oslo ↔ Geilo (train): 2.8 kg CO₂
Total: 562 kg CO₂
Emission factors are based on grams of CO₂ equivalents per passenger per kilometre: domestic flights 255 g/km, European flights 195 g/km, bus 29 g/km, electric train 6 g/km.
Visualization created with assistance from Claude (Anthropic), January 2025.