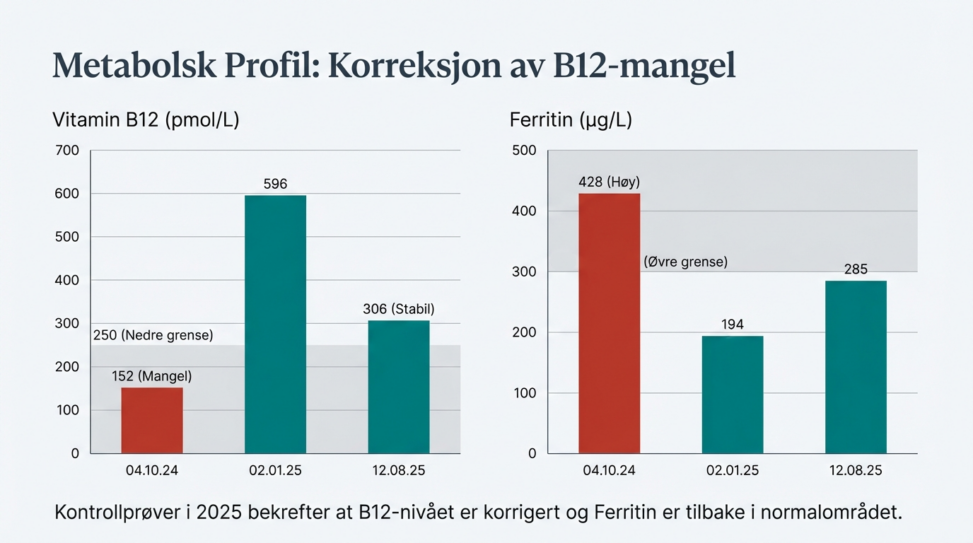
This visualization summarizes changes in two biomarkers across three laboratory timepoints (04.10.24, 02.01.25, 12.08.25). The left chart tracks Vitamin B12 (pmol/L), with a shaded band indicating the lower reference limit (250 pmol/L). B12 is initially low (152) and later returns to values within the reference range (596 and 306). The right chart tracks Ferritin (µg/L), with a shaded band indicating the upper reference limit (300 µg/L). Ferritin is initially elevated (428) and subsequently falls back into the reference range (194 and 285). Overall, the follow-up tests in 2025 indicate normalized B12 status and ferritin levels back within the normal range.