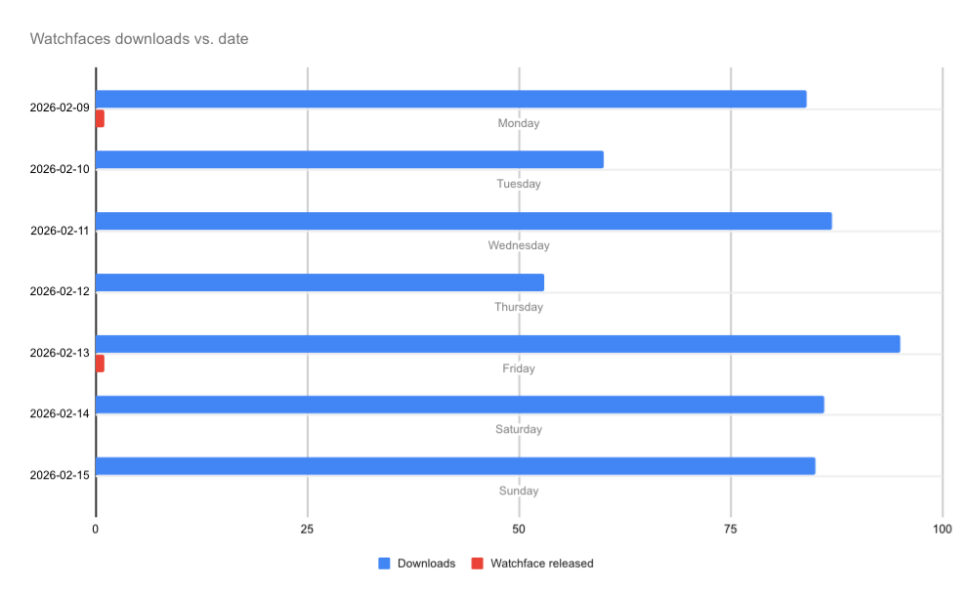
This horizontal bar chart, titled “Watchfaces downloads vs. date”, visualizes daily performance metrics for a one-week period from February 9, 2026, to February 15, 2026. The blue bars represent the total number of downloads per day (unit: count). The small red bars indicate days where a new watchface was released.