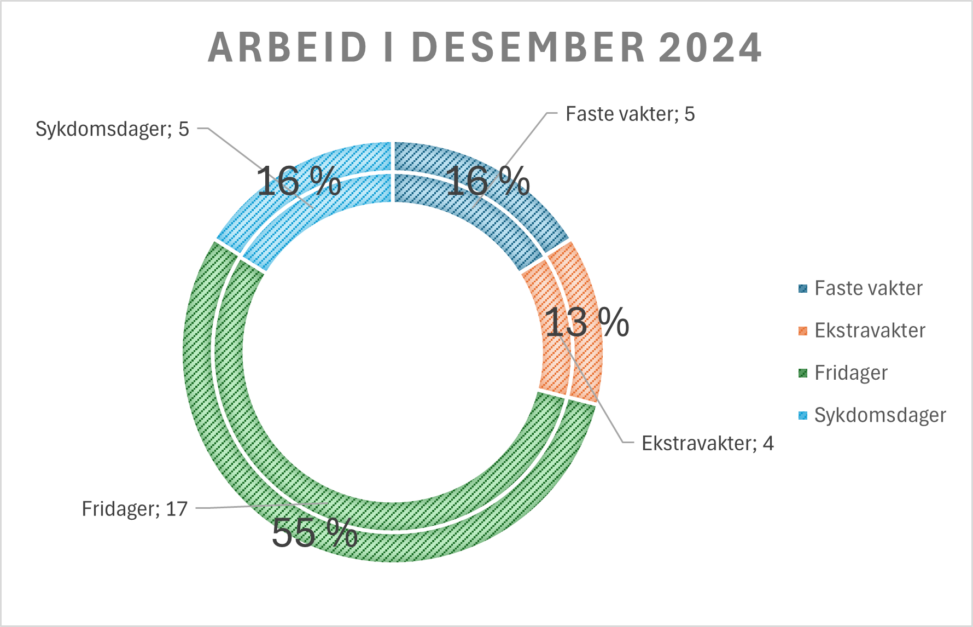
This pie chart shows a months work (Dec 24) for me as a full time student with a part time job on the side.
I have added values for both days of work etc. and the percentage of days I have been to work.
I also included sick days, which were a reason for me not being able to work. My job requires me to take extra shifts on the side, that’s why I felt it was relevant to include the sick days to symbolize the fact that I could’ve worked more than i did.
At last I would like to mention that this pie chart does not talk about salary or hours of work. The reason for this is that I would like to see how many days a month I typically “reserve” myself for work.