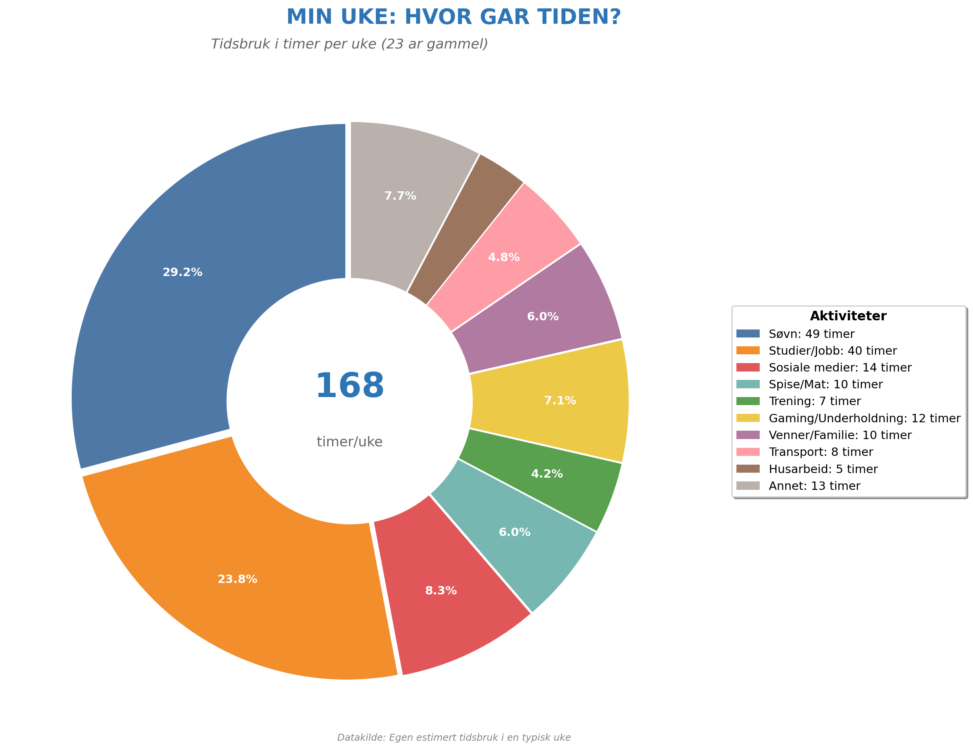
This donut chart visualizes my estimated weekly time distribution as a 23-year-old. The data represents how I spend my 168 hours each week across 10 categories: Sleep (49 hours), Work/Studies (40 hours), Social Media (14 hours), Gaming/Entertainment (12 hours), Eating/Meals (10 hours), Friends/Family (10 hours), Transport (8 hours), Exercise (7 hours), Housework (5 hours), and Other activities (13 hours).
Data source: Personal estimation based on self-reflection of a typical week in January 2025.
Units: Hours per week (total: 168 hours)
Copyright status: This visualization and the underlying data are my own original work and are released under Creative Commons Attribution 4.0 International License (CC BY 4.0). Free to share and adapt with attribution.