
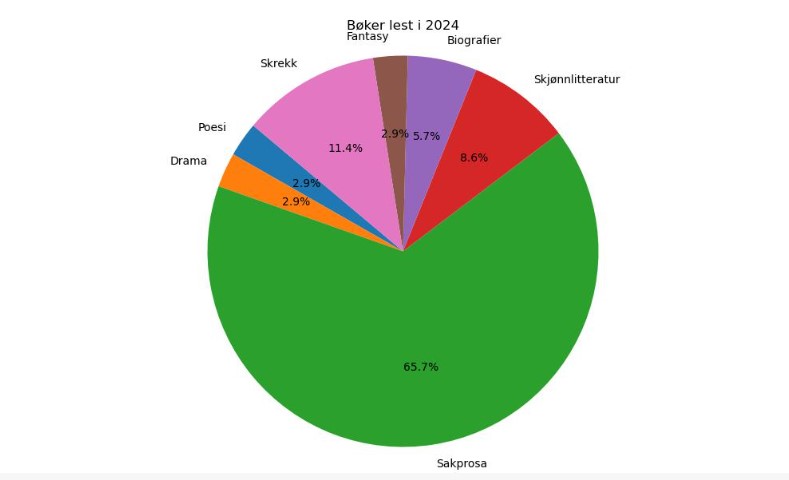
The pie chart shows the distribution of the 35 books I read in 2024, divided into different categories. Here’s what each part of the pie chart represents:
Poetry: 1 book (2.9%)
Drama: 1 book (2.9%)
Non-fiction: 23 books (65.7%)
Fiction: 3 books (8.6%)
Biographies: 2 books (5.7%)
Fantasy: 1 book (2.9%)
Horror: 4 books (11.4%)