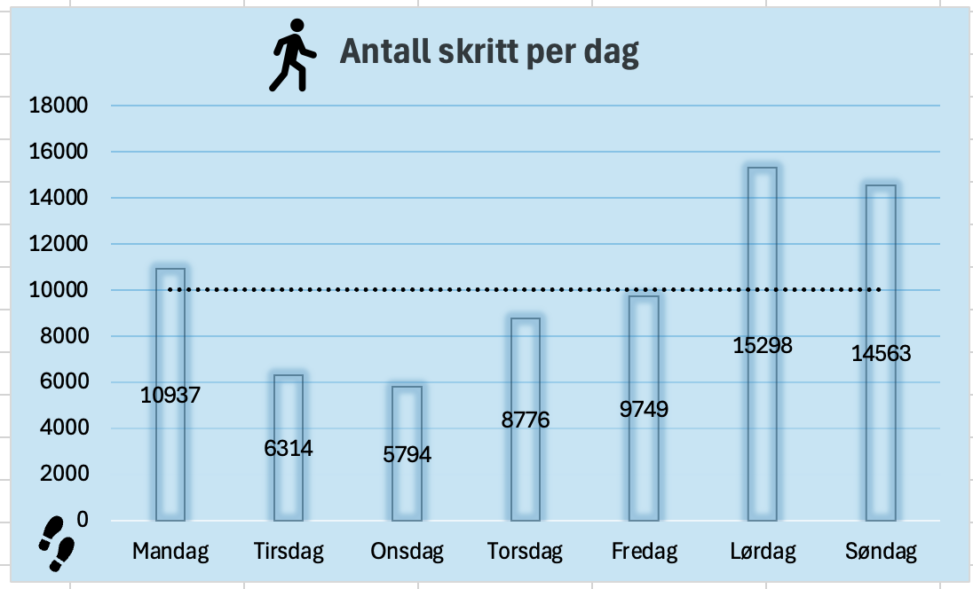
Diagram laget i excel over antall skritt i uken målt opp mot 10.000 som mål med visualisering av hvilke dager som ligger over og under målet

A SPLOT on the Web: DALI worlds.
Blame @cogdog for the TRU Collector Theme, based on Fukasawa by Anders Norén.
Diagram laget i excel over antall skritt i uken målt opp mot 10.000 som mål med visualisering av hvilke dager som ligger over og under målet