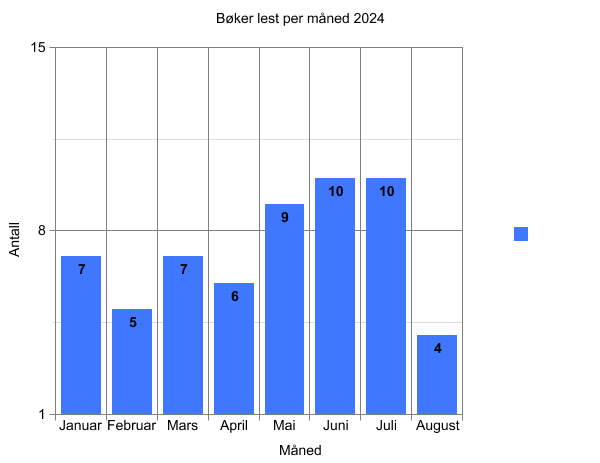
Bar graph, depicting each month of 2024 from january to august. Every month has a number corresponding to the number of books read that month.

A SPLOT on the Web: DALI worlds.
Blame @cogdog for the TRU Collector Theme, based on Fukasawa by Anders Norén.
Bar graph, depicting each month of 2024 from january to august. Every month has a number corresponding to the number of books read that month.