
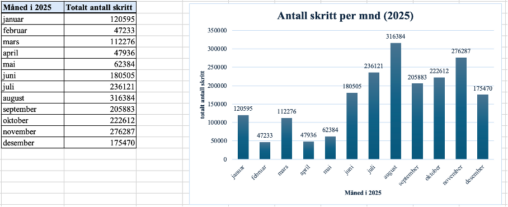
Viser data over antallet skritt jeg har gått hver mnd i 2025. Enhetene er hovedsaklig antallet skritt på y-aksen og måneden i 2025 på x-aksen. Data er hentet…
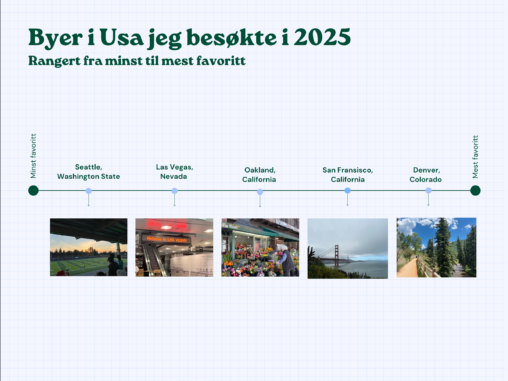
Dette er en visualisering av data som er relevant for meg i min hverdag. Jeg har valgt å vise hvilke byer i Usa jeg besøkte i 2025 og…
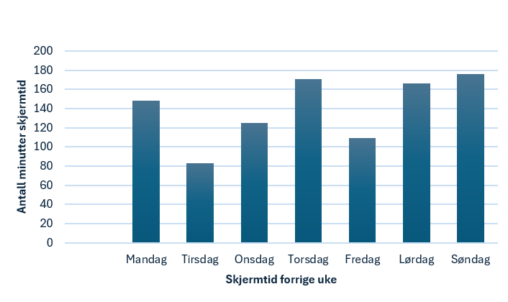
Skjermtid fra forrige uke beskrevet med diagram hvor en ser utvikling over uken.
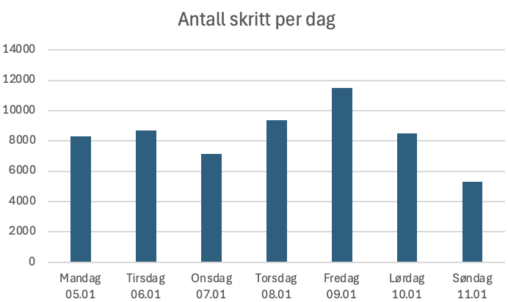
Visualiseringen viser antall skritt gått hver dag i en uke (05.01-11.01). Dataene er funnet på apples app “Health”. For å visualisere dataen har Excel blitt brukt.
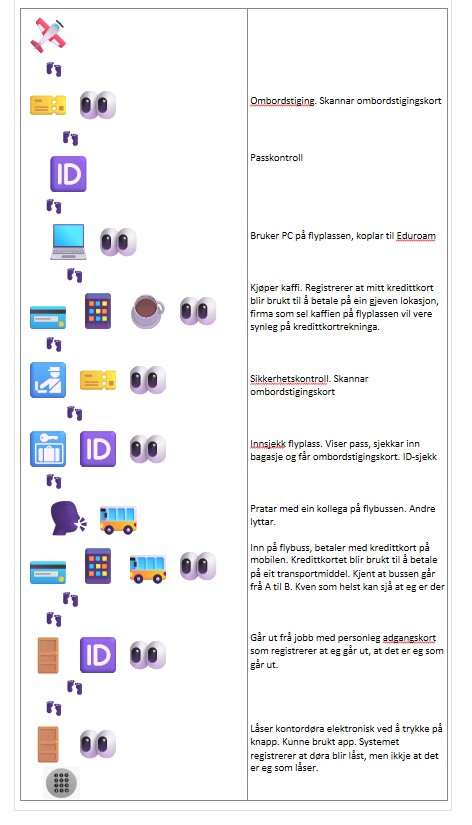
Visuell framstilling av utlevering/registrering av data på ei jobbreise i januar. Spor eg legg att. Augene symboliserer mogleg visuell observasjon, og eg har det med grunna medvit om…
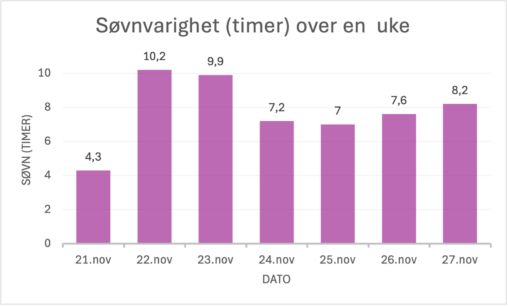
Denne visualiseringen viser min personlige søvnvarighet per natt over en uke, fra 21. til 27. november 2025. Dataene er presentert i antall timer søvn per natt og viser…

En visualisering av hvordan håret mitt har vokst over syv måneder, fra februar til august 2025. Jeg har tatt ett bilder av bakhodet mitt den første dagen i…
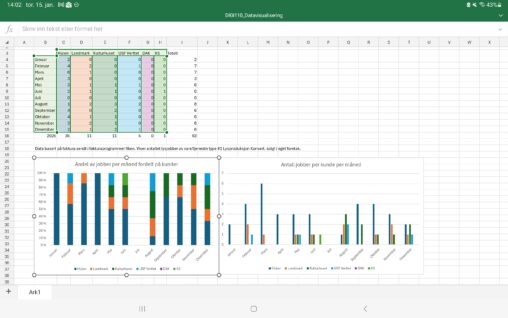
Data viser for hvilke kunder og antall ganger Ole har jobbet for en samlig av kunder gjennom sitt foretak som lystekniker i hele 2025. Data er hentet fra…
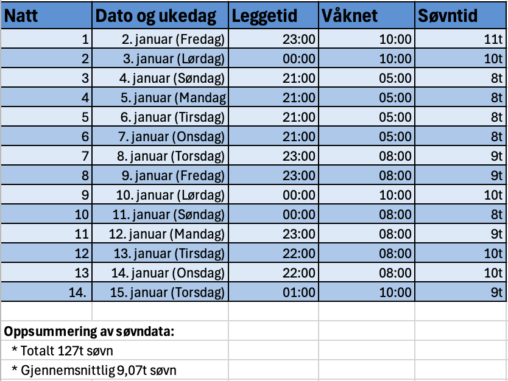
Dette er min søvndata fra 2.januar til 15.januar 2026. Dette er totalt 14 dager med registrert data som også gir en total søvntid på 127t og gjennomsnittlig søvn…
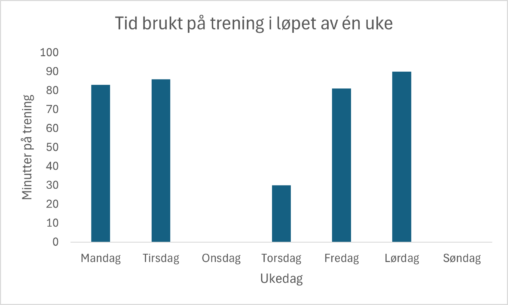
Dataene viser antall minutter jeg trente hver dag i løpet av én uke. Tallene er hentet fra treningsappen jeg bruker for å logge øktene mine, og er visualisert…
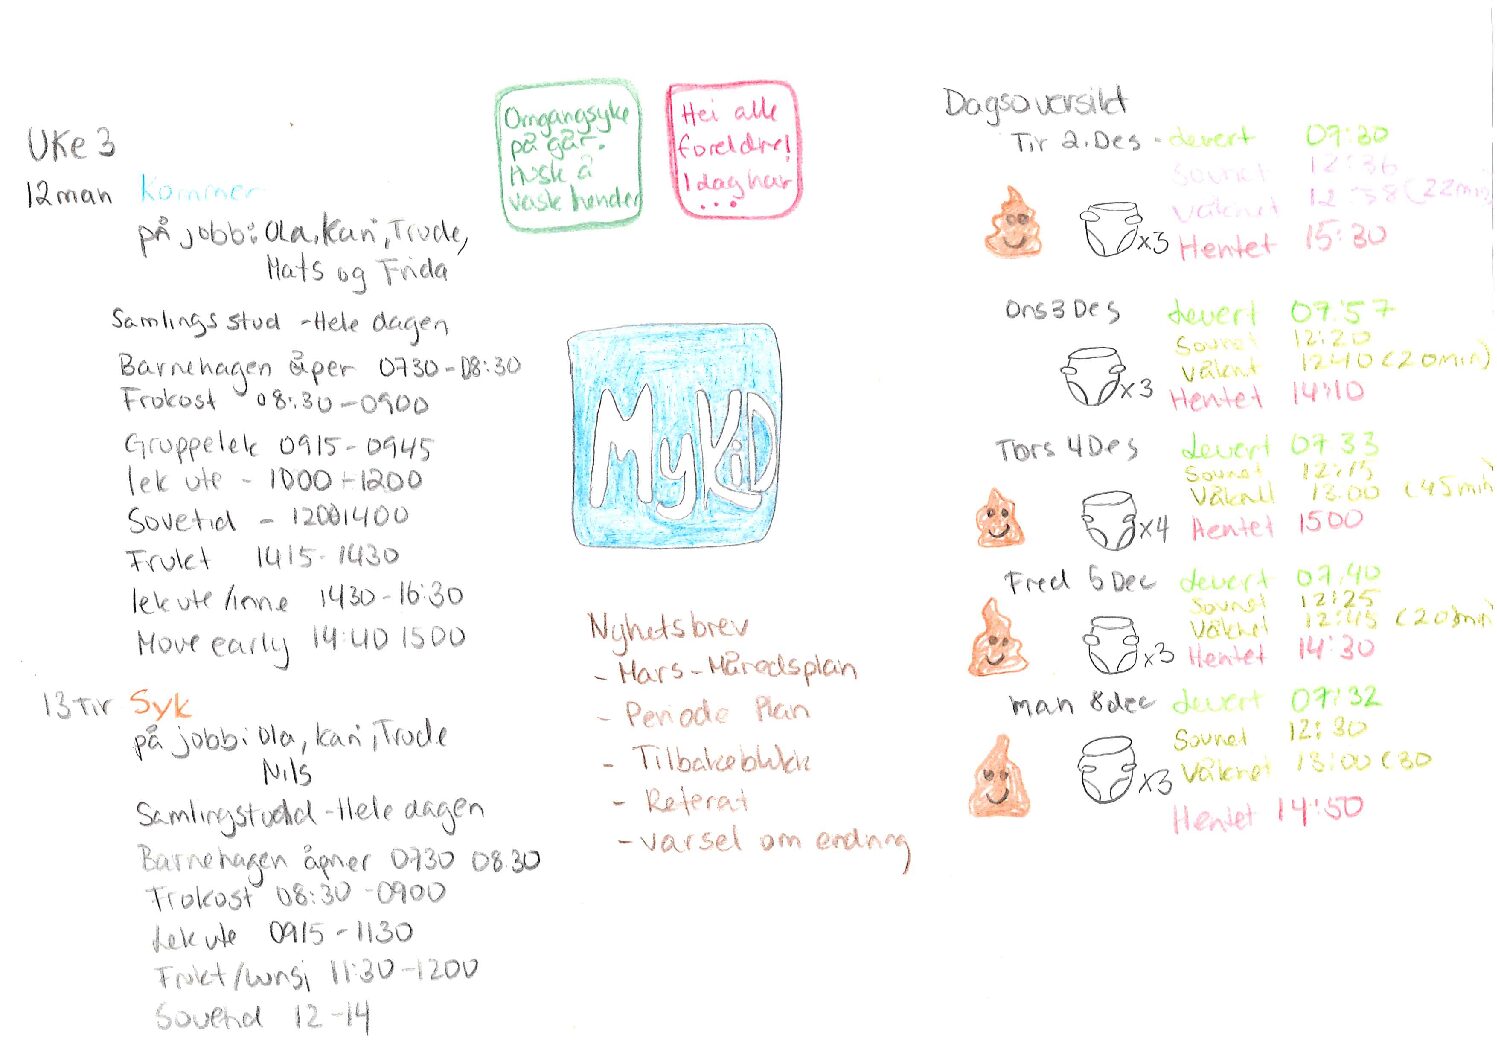
Mykid er en app hvor barnehagen registrere neste alt, hva de gjøre til en hver tid, hvor lenge de skal gjøre en aktivitet, når de spiser, når er…
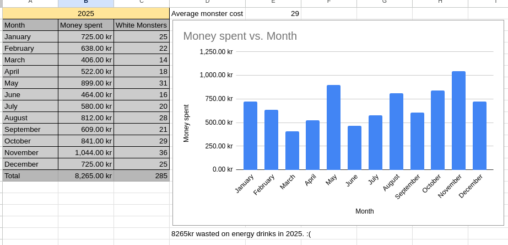
This is a data visualization of how many white monster energy drinks i bought in 2025 and how much money that cost me.
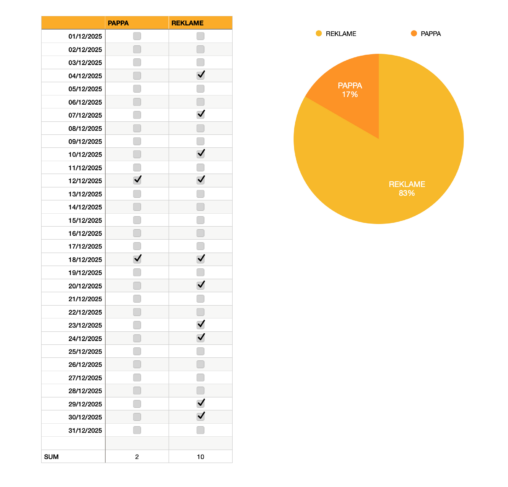
Dette er en tabell over alle dagene faren min har ringt meg i løpet av desember 2025, vs. antall ganger jeg har blitt ringt av ulike bedrifter for…
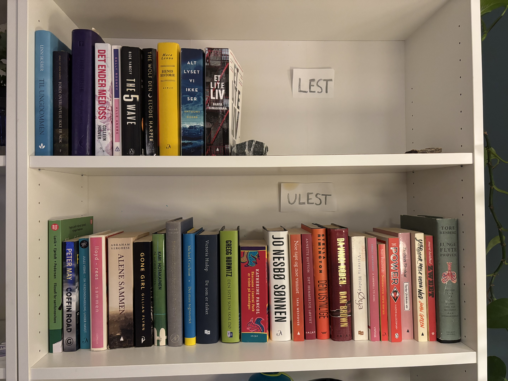
Bildet viser alle bøkene jeg har stående i bokhyllen min i stuen. De er kategorisert etter de jeg har lest (øverst) og de jeg ikke har lest (nederst)…

Dette er alle parfymene jeg har her i Bergen. Bildet visualiserer alle parfymene sortert etter innhold, altså mengde gjenværende væske. Helt til venstre står parfymene som er fulle…
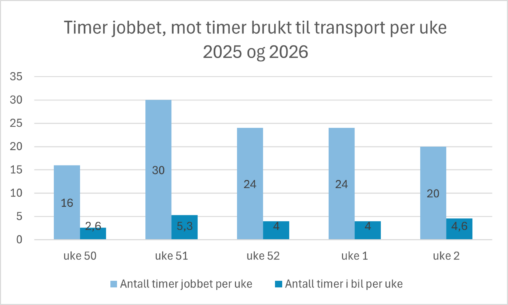
Denne visualiseringen viser hvor mange timer jeg har jobbet i desember og januar, mot hvor mange timer jeg har brukt på transport til- og fra jobb. Dataen er…
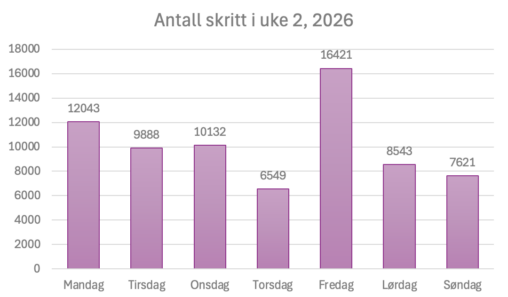
Her er min visualisering av antall skritt jeg tok i uke 2 2026, data er hentet fra min Garmin aktivitetsklokke. Brukt Microsoft Excel for fremstillingen.
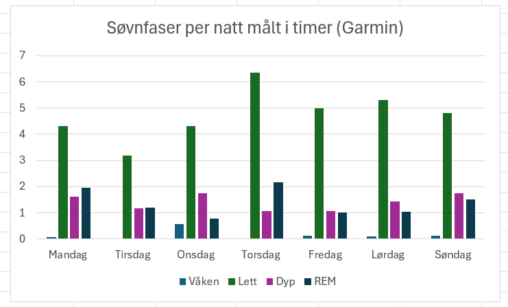
Analyse av søvnfaser, basert på data fra uke 2. Målt med min garmin forerunner 965.

Denne visualiseringen viser antall daglige skritt i uke 2. Dataene er egeninnsamlede, basert på Iphone appen “helse”. Måleenheten er antall skitt per dag. Dataene er personlige og selvproduserte,…
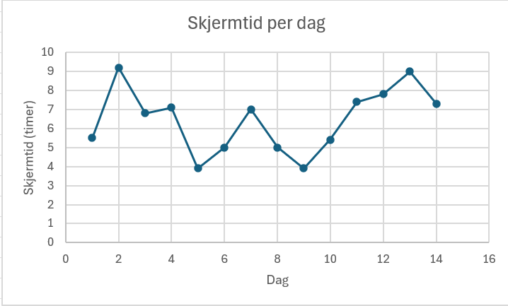
Visualiseringen viser daglig skjermtid over en periode på to uker. Hver prikk representerer total skjermtid for en dag målt i timer, mens linjen mellom punktene gjør det lettere…